Your Scorecard Is Only Telling You Half the Story
Two rounds. Same course. One shot apart.
A while back I played back-to-back rounds at Anthem Country Club. Day one I shot 75. Day two I shot 76.
If you only looked at my scorecard, you'd say I played about the same both days.
I didn't. Not even close!
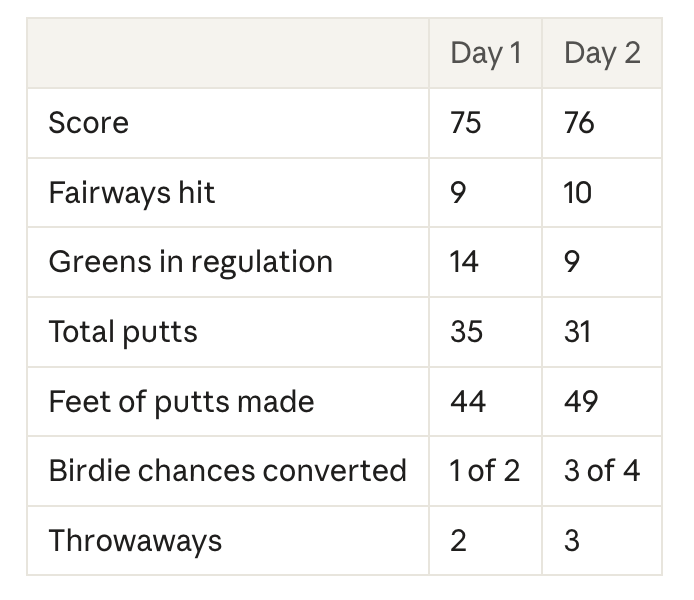
Day one, my ball striking carried me. I hit 14 greens! But my putter left shots out there.
Day two, I only hit 9 greens. My short game and putting saved the round.
Same score. Totally different golfer. And two completely different practice plans for the next week.
That's exactly why I created the Round Report Card.
Your score is the result, not the reason
Most golfers walk off the 18th, look at the number, and decide if it was a good day or a bad day. Then they head to the range and hit a bucket of drivers.
The problem? Your score doesn't tell you why. It doesn't tell you if you're missing greens short, three-putting from 30 feet, or throwing away shots you shouldn't.
The Round Report Card does.
What you track
The card fits on one page and takes about 30 seconds per hole. Here's what goes on it:
- Par and score. The basics.
- Fairway hit and direction. Hit it? Great. Missed it? Left or right? Your miss pattern matters more than your percentage.
- Yards in and club used. Shows you where you're actually hitting approach shots from.
- Green in regulation and direction. Missed the green? Short, deep, left or right?
- First putt distance and total putts. How far you're leaving yourself and how many it takes to get it done.
- Putt distance made. Total feet of putts you hole. This one is eye opening!
- Throwaways. Shots your competition wouldn't give away.
- Opportunities. Birdie putts inside 15 feet, and how many you convert.
The two stats nobody else tracks
Throwaways are the shots that 95% of your direct competition would not make. Think out of bounds, a penalty drop, a sideways punch out, a three-putt inside 50 feet on a flat green, or a missed putt inside 3 feet. It's a little subjective, and that's the point. You know when you gave one away!
Opportunities are birdie putts from 15 feet or less. You mark every one you have, then circle the ones you make. Some courses give you more looks than others, so compare yourself on the same venue when you can.
These two stats tell you more about your mental game and decision making than anything else on the card.
How do you stack up?
The back of the card has benchmarks by handicap index. For example, a 10 to 19 handicap should aim for:
- 40% of fairways
- 8 or more greens
- 34 putts or less
- 50 feet or more of putts made
- 2 or more opportunities
- 5 throwaways or less
Fill out a few rounds and compare. The gaps jump right out at you, and now you know exactly where to spend your practice time.
How to use it
- Print a few and keep them in your bag.
- Fill it out as you play, or right after while it's fresh.
- Total up your front 9, back 9 and full round.
- Compare your numbers to the benchmark for your handicap.
- Pick ONE area to work on before your next round.
That's it. No app, no fancy launch monitor. Just a pencil and a little honesty.
What's coming next
This is the first post in a series. Next up, we'll break down each part of the card, starting with fairways and why your miss pattern matters more than your fairway percentage.
Grab your free Round Report Card!
Ready to find out what your score isn't telling you? Download your free Round Report Card, print a stack, and start tracking this week!